


R package to visualize geoelectric resistivity measurement profiles.
Electrical resistivity tomography is an efficient geophysical technique to investigate the spatial extent of subsurface structures. Many scientific objectives in geology demand three-dimensional imaging. 3D electrical resistivity tomography provides a technique to survey three-dimensional structures. Nonetheless, 3D electrical resistivity tomography requires an enormous amount of time as well as a high work load. In most cases, 2D electrical resistivity tomography is used to obtain two-dimensional subsurface profiles. This R package enables the user to visualize two-dimensional profiles in three dimensions.
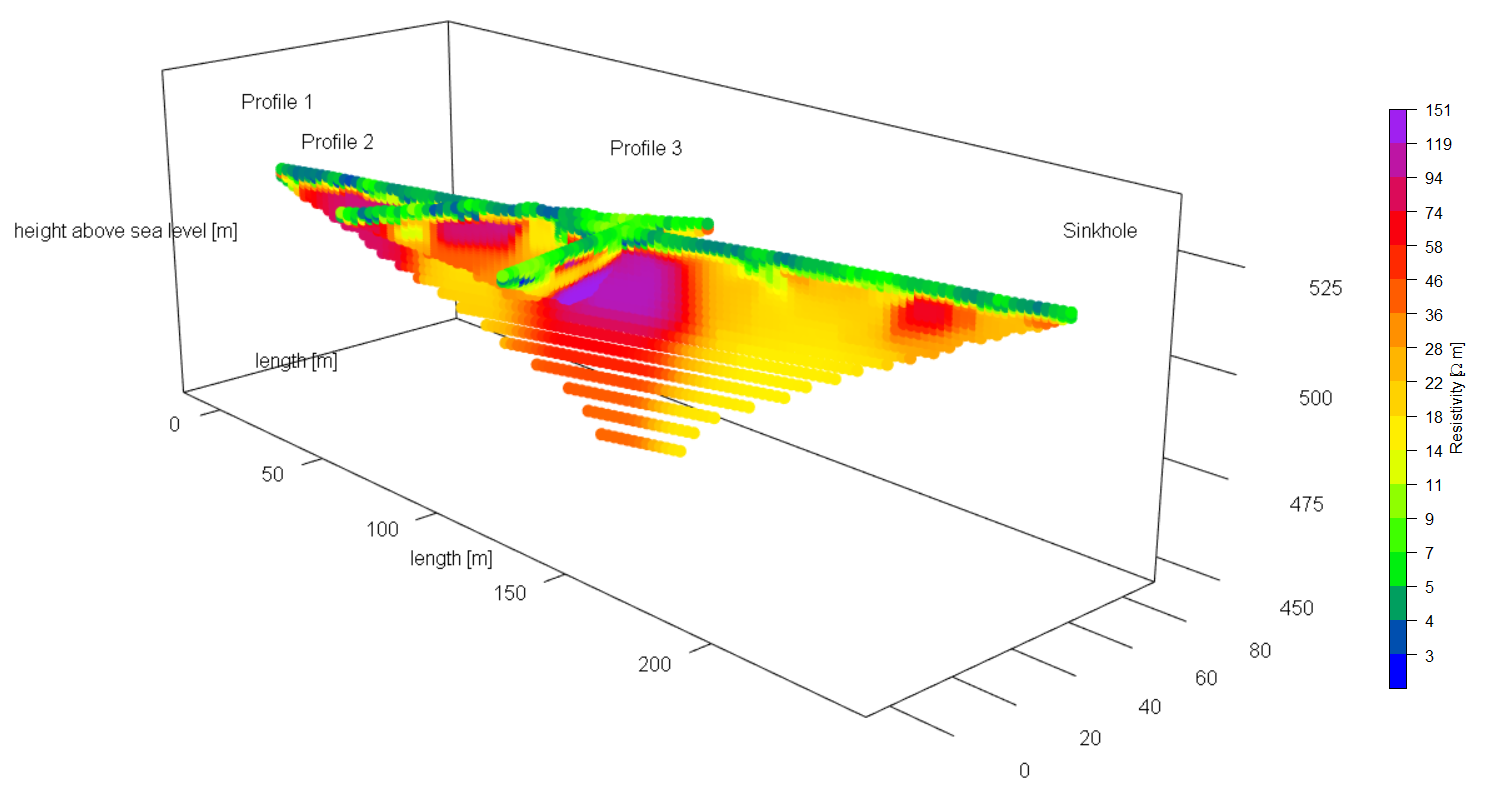 Example plot created with the geoelectrics R package.
The following prerequisites are necessary for the geoelectrics R package:
You need to install the devtools package to build the geoelectrics package from source code:
install.packages('devtools')
library(devtools)
Perform ONE of the following steps to build the geoelectrics package:
install_github('kleebaum/geoelectrics')
build()
The geoelectrics package is available via the Comprehensive R Archive Network (CRAN).
install.packages('geoelectrics')
library(geoelectrics)
The domain model shows the fundamental classes involved in electrical resistivity tomography. A 2D subsurface profile comprises GPS coordinates (latitudinal, longitudinal, and height information) and raw data. The raw data is collected using a certain type of measurement (e.g., Dipole Dipole or Wenner). The raw data needs to be processed resulting in processed data. A profile set comprises 2D profiles.
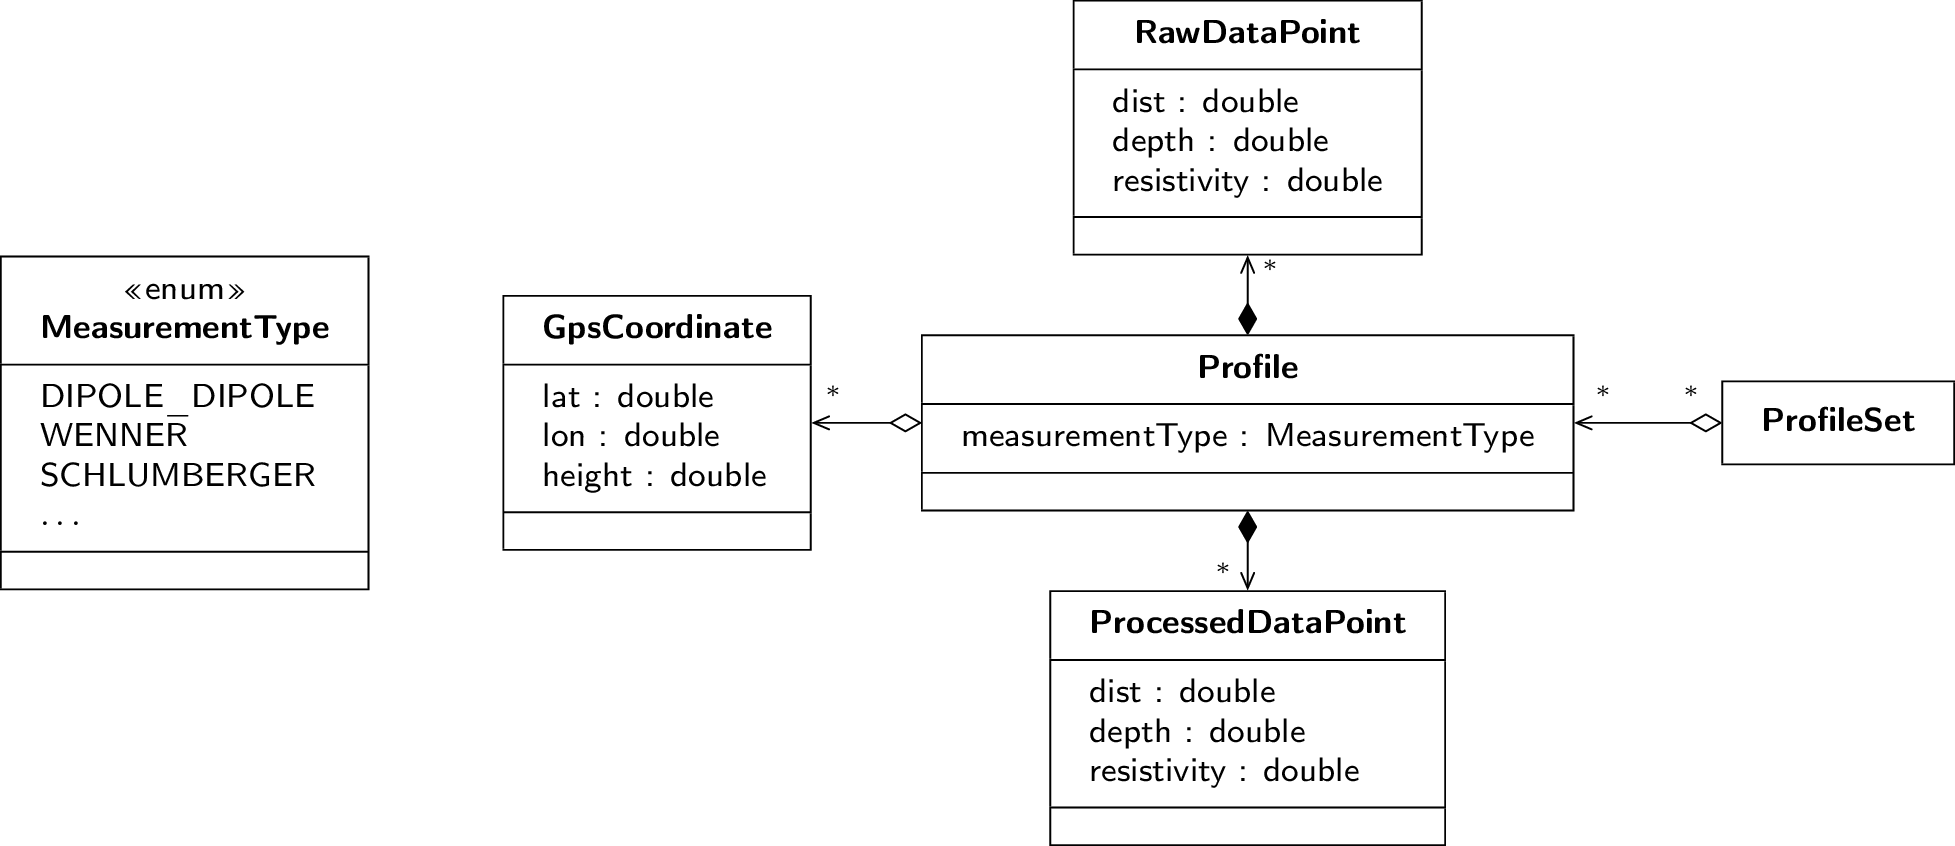 Domain model for electrical resistivity tomography
The geoelectrics R package provides five model classes to represent geolectric resistivity measurement data:
parseRawDataFile() method is used to parse geoelectrics raw data files created by the GeoTest software by Dr. Rauen. You need to overwrite the parseRawDataFile() method if you want to use another raw data format.parseProcessedDataFile() method is used to parse .xyz files produced by the software Res2DInv. You need to overwrite the parseProcessedDataFile() method if you want to use another processed data format.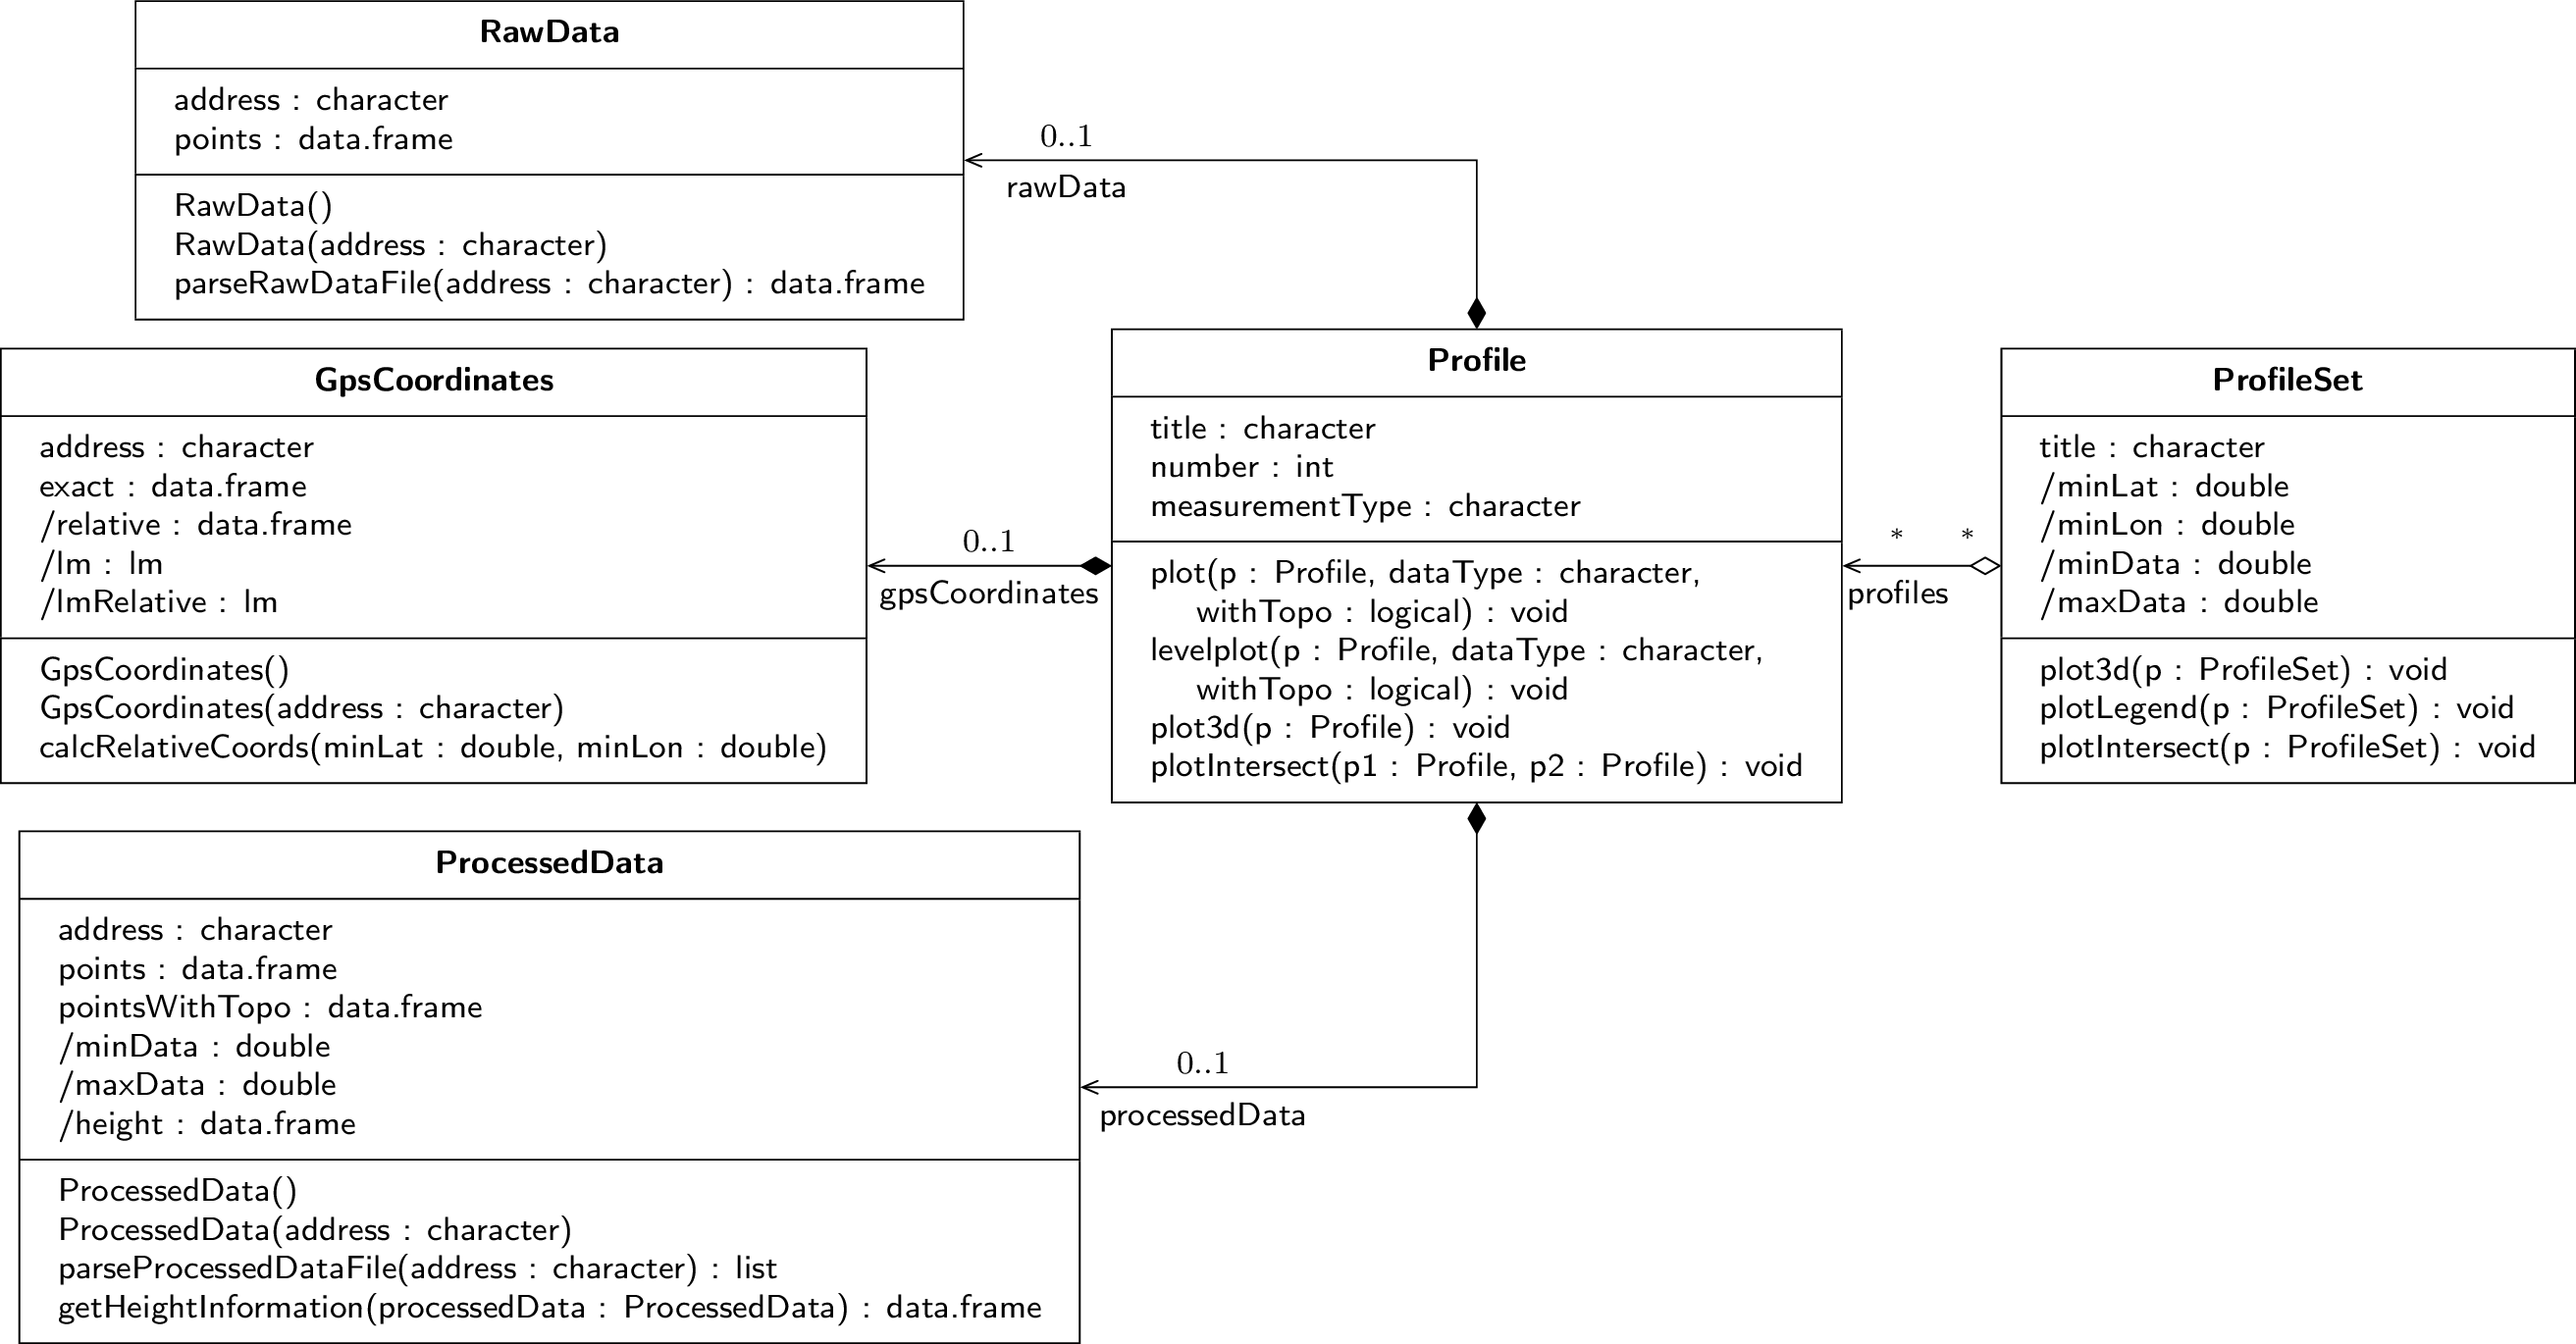 Class diagram of the geoelectrics R package
library(geoelectrics)
demo(geoelectrics)
data(sinkhole)
Run demo(geoelectrics) to get an impression of the geoelectrics R package and have a look at the demo script.
Run data(sinkhole) to load the example data.
An object of the Profile class is created for each profile:
p1 <- new(
  'Profile',
  title = 'Profile 1',
  processedData =
    new('ProcessedData',
        address = system.file('extdata/processed/p1_DipolDipol_SW-NE.xyz',
                  package = 'geoelectrics')),
  rawData =
    new('RawData',
        address = system.file('extdata/raw/p1_DipolDipol_SW-NE.dat',
                  package = 'geoelectrics')),
  measurementType = 'DipoleDipole',
  gpsCoordinates =
    new('GpsCoordinates',
        address = system.file('extdata/gps/p1.txt', package = 'geoelectrics'))
)
An instance of the ProfileSet class is created using a list of single profiles:
sinkhole <- new('ProfileSet',
                profiles = list(p1, p2, p3),
                title='Sinkhole')
GPS measurement heights might differ due to inaccuracy of measurement. Therefore, the height of a single profile can be adjusted:
p3 <- adjustHeight(p3, -10)
Run data(sinkhole) to load the example data.
plot3d(sinkhole)plotLegend(sinkhole)plotIntersect(sinkhole)plot(sinkhole@profiles[[1]], dataType = 'raw', withTopo = FALSE)plot(sinkhole@profiles[[1]], dataType = 'raw', withTopo = TRUE)plot(sinkhole@profiles[[1]], dataType = 'processed', withTopo = FALSE)plot(sinkhole@profiles[[1]], dataType = 'processed', withTopo = TRUE)levelplot(sinkhole@profiles[[1]], dataType = 'raw')levelplot(sinkhole@profiles[[1]], dataType = 'processed', withTopo = FALSE)levelplot(sinkhole@profiles[[1]], dataType = 'processed', withTopo = TRUE)Parse a .xyz file produced by the software Res2DInv:
parseProcessedDataFile(address = system.file('extdata/processed/p1_DipolDipol_SW-NE.xyz',
                                 package = 'geoelectrics'))
Parse a raw data file created by the GeoTest software by Dr. Rauen:
parseRawDataFile(address = system.file('extdata/raw/p1_DipolDipol_SW-NE.dat',
                           package = 'geoelectrics'))
This R package provides a graphical user interface (GUI).
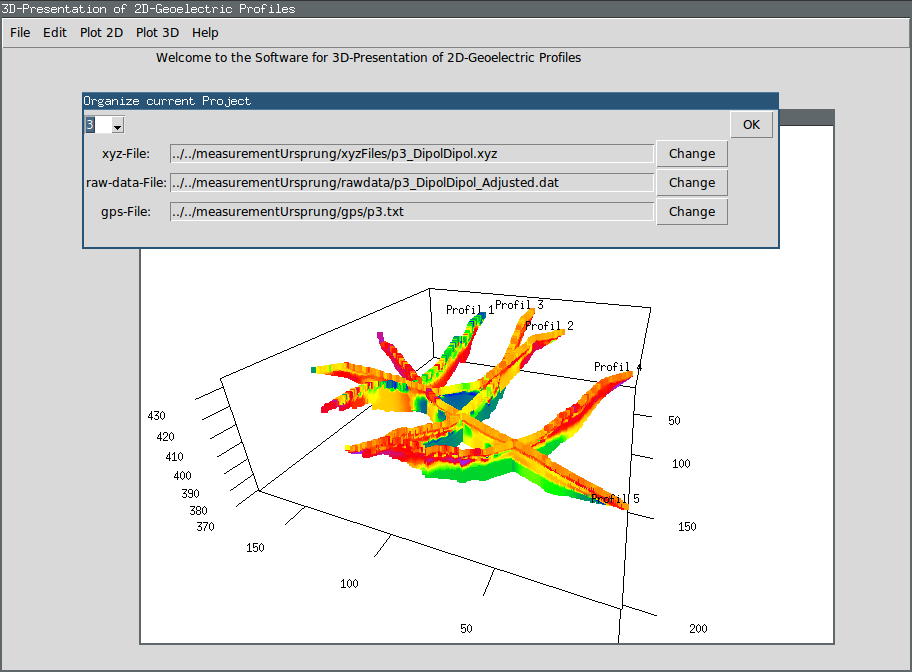 Graphical user interface of the geoelectrics R package
The following packages are needed for the GUI:
Perform ONE of the following steps to start the GUI:
source(system.file('gui/gui.r', package='geoelectrics'))
The inversion of two-dimensional geoelectrical resistivity measurement data (raw data) is currently not supported by this package. Please feel free to implement the inversion and create a pull request.